-40%
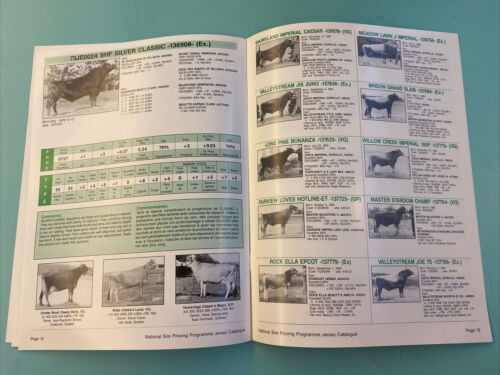
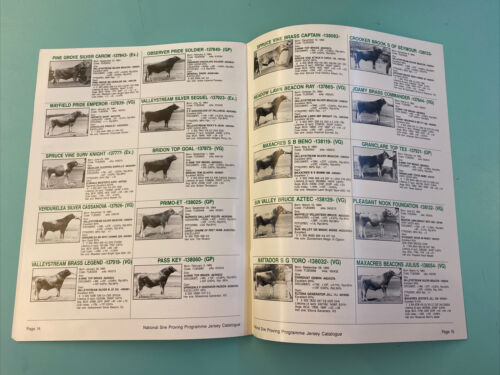
1988 Jersey Breeding Service Sales Brochure Catalog Semex Canada Cows
$ 26.4
- Description
- Size Guide
Description
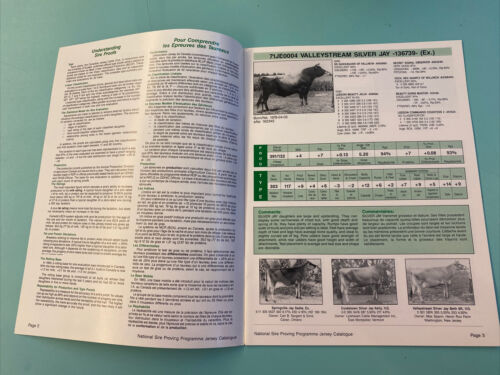
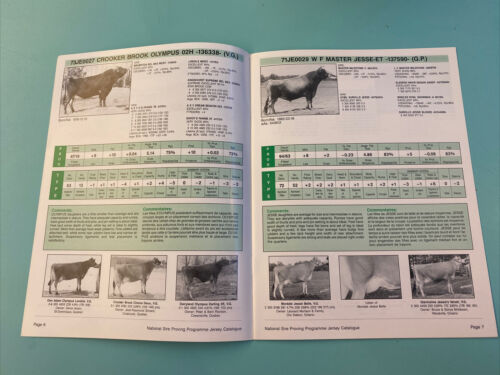
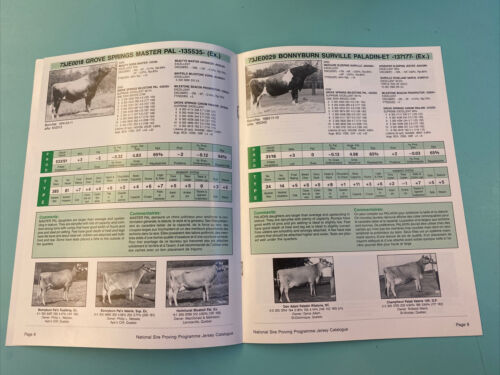
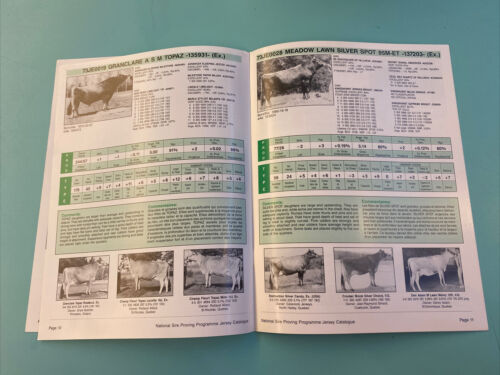
Excellent or better condition. 16 pagesUnderstanding
Sire Proofs
Туре
Twice yearly, the Canadian Jersey Cattle Club, in conjunction with
the University of Guelph, publishes official type proofs using a statistical
procedure known as Best Linear Unbiased Prediction (BLUP). These
proofs are based on the linear classification data and an expanded
statistical model for sire evaluation. The complete type summary pro-
vides sire evaluations for 32 traits.
Linear Classification
On the current classification forms, general and descriptive traits are
evaluated on a scale from 1 to 9. Scorecard traits can be broken down
into 18 classes. Each of the six classification categories, i.e. Ex, VG,
GP, G, F and P are split into three subcategories (for example GP',
GP², GP³, GP³ being the highest), making a total of 18 possibilities.
Linearized type classification, along with the increase in the number
of classification categories, offers greater accuracy and hence a signifi-
cant improvement in both cow and sire evaluation.
The Statistical Model for Sire Evaluation
Adjustments are made to attempt to remove external factors which
influence the average classification of a sire's daughters. The sources
of variation corrected for, are as follows:
age at classification,
stage of lactation,
type rating of the dam of each classified daughter,
herd-round-classifier relationship,
relationship among sires in the breed (genetic relationship
matrix).
In addition, the proofs are calculated using only first classification
and first lactation cows aged between 17 and 60 months.
The variation in each type trait has been standardized in such a way
that 67% of the sires evaluated are expected to have a proof ranging
between +5 and -5 but the total distribution can range from +20 to
-20.
Production
The production proofs published by the Animal Production Division
of Agriculture Canada are issued twice a year. They are calcuated from
records made in ROP or official provincially tested herds such as ODHIC
and DHAS-Official. The base for sire evaluation is updated annually
with each round of spring proofs.
The Ratings
The most important figure which denotes a sire's ability to increase
production is his milk rating. A typical future daughter of a sire rated
+10 for milk, fat or protein can be expected to produce 10 BCA points
more (about 350 kg or 770 lb of milk, 19 kg or 42 Ib of fat and 12 kg
of 27 Ib of protein) than a typical daughter of a zero-rated sire during
a 305 day lactation.
A plus fat rating means more total fat during the lactation, but does
not necessarily mean an increase in fat test.
Canada's BCA system adjusts milk and fat production for the age of
the cow and her month of lactation. The values of one BCA point of
milk, fat and protein for mature cows in the Jersey breed are given as
follows: 35.0 kg (77 Ib) of milk, 1.87 kg (4.12 lb) of fat and 1.21 kg (2.67
Ib) of protein.
Fat and Protein Deviations
Breeders wishing to improve fat or protein tests should select bulls
showing plus deviations. A typical future daughter of a sire with +.05%
rating is expected to test .05% higher than a typical daughter of a zero-
rated sire. Although it depends on the scattering of daughters, on the
average, the progeny of zero-rated sires test close to breed average for
fat or protein teste
The Rolling Base
In 1983, a rolling base for sire evaluation was introduced in Canada.
With the new rolling base, the average of all A.I. bulls in Canada is now
+1.3 for milk, +0.1 for fat and +1.5 for protein.
The rolling base group is comprised of all bulls (a) whose first
daughters freshened during the last 5 years and (b) had 20 or more
daughters in five or more herds.
Repeatability for Production and Type Proofs
Repeatability is a measure for the accuracy of a sire's proof. Its values
can go as high as 99% and depend on the number of progeny per sire,
their distribution across herds and the heritability of the trait. The higher
the repeatibility, the more accurate the proof, and the less likely it will
show a significant change in the future.
Page 2
